Geographer - Urban Planner
Mapping flood exposure in 3D: a method you can reuse anywhere
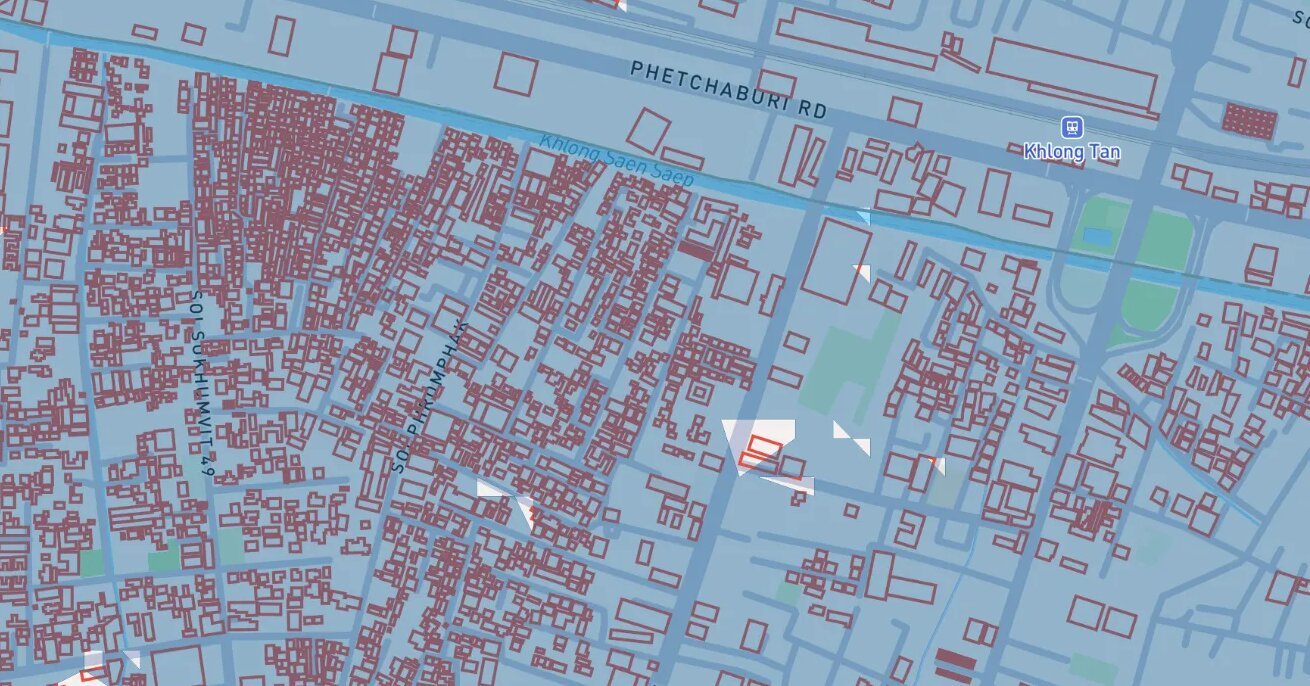
How can you simply visualise which buildings could be exposed to flooding depending on water depth?
I built an interactive 3D map from topographic data and building data. The principle is deliberately simple: adjust the water level with a slider and instantly see which buildings sit on ground lower than that level.
See the interactive Bangkok map →
A simple method: elevation, water depth and buildings
The method combines two main pieces of information: ground elevation and building locations.
Using a digital terrain model (DTM), you can estimate the ground elevation around or beneath each building. Different water depth scenarios are then defined: 50 cm, 1 m, 1.5 m, 2 m, and so on.
A building whose ground elevation is lower than the chosen water level is considered potentially exposed.
The 3D view then displays this information directly on the buildings, with a slider to explore the different scenarios.
Why 3D?
On a 2D map, information such as "building exposed from 1 m of water" remains fairly abstract.
3D, on the other hand, directly connects the terrain, the buildings and the water level. As the water rises, the potentially exposed areas gradually appear.
The goal is not necessarily to produce a more complex simulation, but to make geographic information easier to grasp at a glance.
A method that works on other territories
Bangkok is the case study here, but the method is not specific to the city.
It can be reproduced on any territory with sufficiently accurate elevation and building data.
The data can come from open sources, such as OpenStreetMap for buildings and the terrain models available in each country or region.
The workflow can be adapted to a municipality, a metropolitan area, a river basin or any other study area, with different data sources and levels of accuracy depending on the context.
The advantage is precisely having a fairly lightweight method that can be adapted to different territories without always requiring a full hydraulic model.
A visualisation, not a hydraulic simulation
This distinction matters.
The map shows potential exposure based on ground elevation. It does not simulate the actual dynamics of a flood.
In particular, it does not account for how fast water spreads, drainage networks, hydraulic structures, flow paths, obstacles, or the interactions between these phenomena.
A regulatory study or detailed hydraulic analysis would therefore require dedicated models.
However, this approach can be useful to quickly explore a territory, communicate about a risk, or produce a first spatial visualisation before moving on to more complex analyses.
From prototype to reproducible tool
The aim of this project was less to produce a map specific to Bangkok than to explore a 3D mapping workflow that can easily be transferred to other places.
With fairly accessible geographic data, it is possible to build an interactive visualisation that lets you test different scenarios and makes a complex issue much easier to read.
That is the value of this kind of prototype: once the workflow is in place, it can be adapted to other cities and to other risk or exposure issues.
If you are working on a similar issue, for your city or your territory, feel free to get in touch and we can talk it through.
