Geographer - Urban Planner
OSM and 3D: how to enrich missing building heights
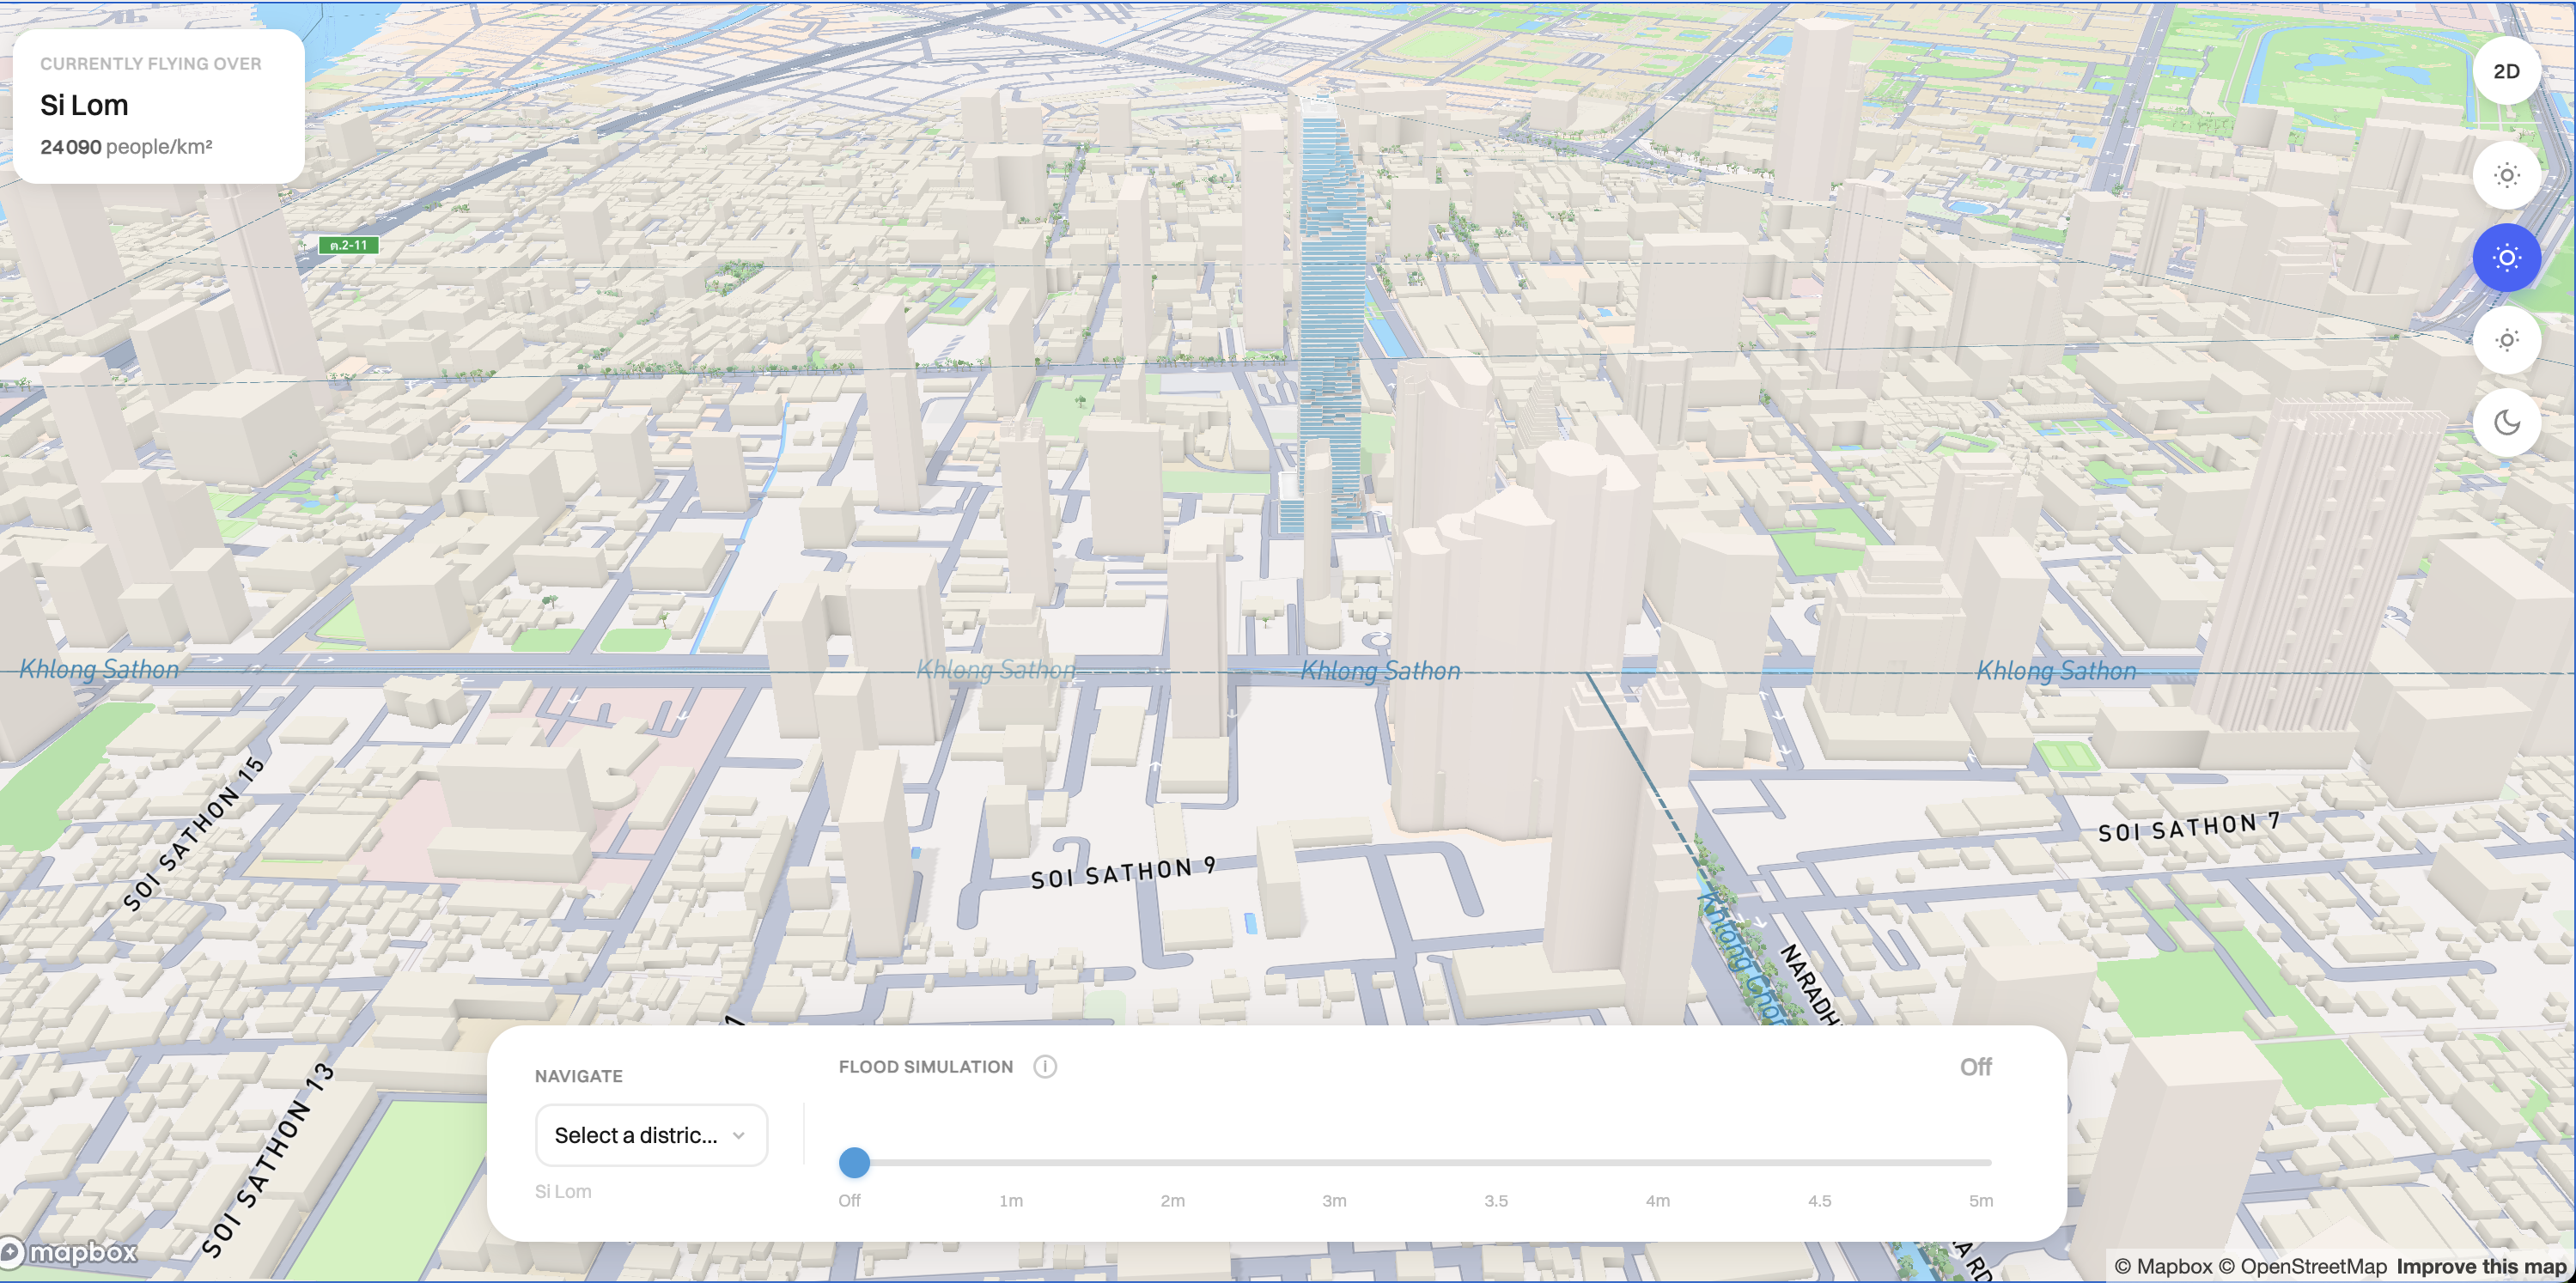
When building a 3D map of Bangkok with Mapbox, I quickly ran into a data volume problem: almost every building had exactly the same height. That's the default value OpenStreetMap assigns when no height data is available: 4 metres. The result was a perfectly flat city with no urban skyline, where a 30-storey tower looks identical to a two-room house.
Here's the methodology I developed to fix this in QGIS, using open data. It can be reproduced for any city.
A universal problem
Before looking for a solution, a quick audit of Bangkok's OSM buildings:
0.2%of buildings have a height tag different from the 4m default
2.2%have a building:levels tag
84.6%are at the default value of 4 metres
Today, almost all map providers draw from the same OSM data. Coverage is decent in Germany, the Netherlands and a few well-contributed American and Japanese cities. Everywhere else, it's the same story.
The methodology in four steps
The core idea: if a building has no height, identify the administrative district it belongs to, assign it the median height of neighbouring buildings in the same district that do have data, then apply a minimum floor height by building type.
1. Convert levels to heights
OSM contributors often fill in the number of floors via the building:levels tag rather than an absolute height. We can use this data by creating an height_estimate field in the field calculator:
CASE
  WHEN "height" IS NOT NULL THEN to_real("height")
  WHEN "building:levels" IS NOT NULL AND "building" IN ('commercial','retail','office')
       THEN to_real("building:levels") * 3.5
  WHEN "building:levels" IS NOT NULL
       THEN to_real("building:levels") * 3
END
3 metres per floor, 3.5 for commercial types where ceiling heights are greater.
2. Join each building to its subdistrict
Bangkok is divided into administrative subdistricts. The Join attributes by location tool assigns the subdistrict identifier to each building (predicate "is within"). This is the reference unit used for imputation.
3. Impute the median by subdistrict
For each building without a height, we take the median of buildings in the same subdistrict that have a real value (above 4m, to exclude defaults). We only impute if the subdistrict has at least 10 reliable buildings; below that threshold there isn't enough local information to do it without introducing noise. The field calculator handles everything in a single expression using aggregate():
CASE
  WHEN "height_estimate" IS NOT NULL THEN "height_estimate"
  WHEN aggregate('buildings','count',"height_estimate",
        filter:="subdistrict" = attribute(@parent,'subdistrict') AND "height_estimate" > 4) >= 10
  THEN aggregate('buildings','median',"height_estimate",
        filter:="subdistrict" = attribute(@parent,'subdistrict') AND "height_estimate" > 4)
END
I initially set the threshold at 20. Dropping it to 10 quadrupled the number of buildings enriched, from around 20,000 to 88,000.
4. Set a minimum height by building type
Some types have known physical constraints regardless of local context. A school or hotel rarely comes in at 4 metres. We apply a minimum height to remaining buildings, again in the field calculator:
CASE
  WHEN "height_imputed" IS NOT NULL THEN "height_imputed"
  WHEN "building" = 'school'      THEN 12
  WHEN "building" = 'university'  THEN 15
  WHEN "building" = 'hotel'       THEN 24
  WHEN "building" = 'industrial'  THEN 8
  WHEN "building" = 'warehouse'   THEN 8
  WHEN "building" = 'commercial'  THEN 6
  WHEN "building" = 'house'       THEN 6
  WHEN "building" = 'semidetached_house' THEN 6
  WHEN "building" = 'apartments'  THEN 9
  ELSE 4
END
The resulting height_final field can then be used directly for extrusion in QGIS 3D view, or as the height attribute in a web map (Mapbox, MapLibre). The full reference table of heights by building category is at the end of this article.
Results
Buildings at default value: from 84.6% down to 19.1%
Buildings updated: 105,807
Via subdistrict median: 88,273
Via type minimum height: 12,884
Limitations
This is statistical imputation, and it is only useful for improving the visual quality of a 3D map. It is not valid for statistical or scientific work.
The subdistrict median smooths out intra-neighbourhood variation: a 35-storey tower and a two-storey wooden house can coexist 50 metres apart in the same subdistrict, and the median will assign them the same height. The remaining 19% are mostly yes-type buildings with no type or level data, in low-density areas where the threshold of 10 is never reached — often peri-urban zones where 3D rendering is less relevant anyway.
Data and resources
I recommend using Geofabrik to download all OSM buildings. Subdistrict boundaries are also available via OpenStreetMap, on Geofabrik or through an Overpass query.
The Bangkok 3D map that motivated all of this includes a flood risk visualisation by water level across 154,000 buildings, available here.
Reusable reference table
Minimum heights by building type applied in step 4, calibrated on the Bangkok context. Adjust for your city, but usable as a starting point.
| Building type | Minimum height |
|---|---|
school | 12 m |
university | 15 m |
hotel | 24 m |
industrial / warehouse | 8 m |
commercial | 6 m |
house / semidetached_house | 6 m |
apartments | 9 m |
